Serial Communication Examples
This tutorial (originally published here) demonstrates how to use a Raspberry Pi Pico as a live-data source in LabPlot via serial communication. The examples show how to stream real-time data from a microcontroller to create live updating plots.
Note
While these examples were created in collaboration with the core LabPlot developer team, they do not reflect in any way the thoughts or intentions of any of the LabPlot developers.
Prerequisites
Hardware Requirements
Raspberry Pi Pico or compatible microcontroller
USB cable for connection to your computer
Computer running Linux, Windows, or macOS
Software Requirements
LabPlot (version 2.10 or later recommended)
PlatformIO for code compilation (using Arduino framework)
Terminal emulator for testing:
Important
On Linux systems, make sure to follow PlatformIO’s documentation to install the appropriate udev rules so your Pico shows up as a tty device.
Code Configuration
The example Pico code includes several configurable parameters at the top of the source file:
// ----------------------------------------------------------------------------
//  Parameters
// ----------------------------------------------------------------------------
#define BAUDRATE  9600   // Serial baudrate
#define SEPERATOR ","    // Seperator between multiple ASCII values in multiASCII mode
#define INTERVAL  1000.0 // Send interval in milliseconds

// Mode, choose one.
enum mode {
  singleASCII,  // --> One ASCII value every INTERVAL. No Newline or seperator. 9 decimals.
  multiASCII,   // --> ASCII CSV of several values every INTERVAL. separated by SEPERATOR. 9 decimals.
  singleBinay,  // --> One binary value every INTERVAL. Formatted TODO
  multiBinary   // --> Several binary values every INTERVAL. Formatted TODO
};

const uint8_t mode = singleASCII;
Default Settings
Baudrate: 9600 bps
Send interval: 1000 ms (1 second)
Mode: Single ASCII value
Decimal precision: 9 digits
Uploading Code to the Pico
First Upload (Manual Process)
The very first time you connect the Pico to your PC, it will appear as a mass storage device and won’t accept serial uploads through PlatformIO. Follow these steps for the initial upload:
Build the project in PlatformIO using the “Build” task
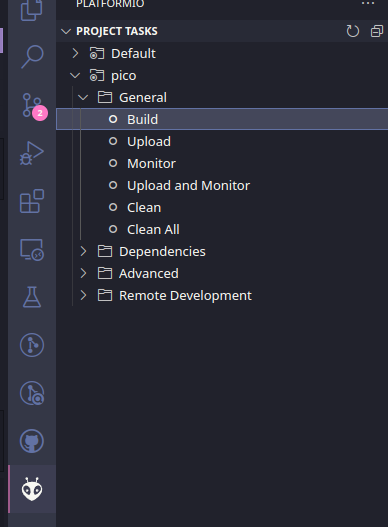
Execute the Build Project Task in PlatformIO
Locate the firmware file: Find the generated
firmware.uf2file in PlatformIO’s build directory
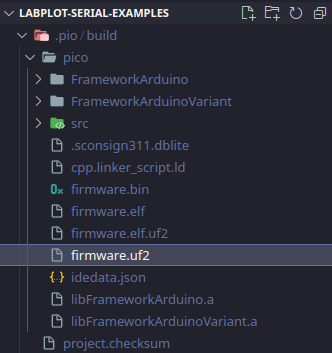
Location of the generated firmware.uf2 file in PlatformIO’s build directory
Copy to Pico: Drag and drop
firmware.uf2to your Pico (it appears as a USB flash drive)Restart: Power cycle your Pico by unplugging and plugging it back in
Tip
Subsequent code uploads are much easier, as PlatformIO should automatically detect your Pico when executing upload tasks. Only the first upload needs to be done manually.
Identifying the Serial Port
Linux
When your Pico is connected, it will appear as a tty device. To find it:
# Check system messages for new USB devices
sudo dmesg

# List all tty devices
ls /dev/tty*
The Pico typically appears as /dev/ttyACM0 or similar.
Output of sudo dmesg right after plugging in the Pico:
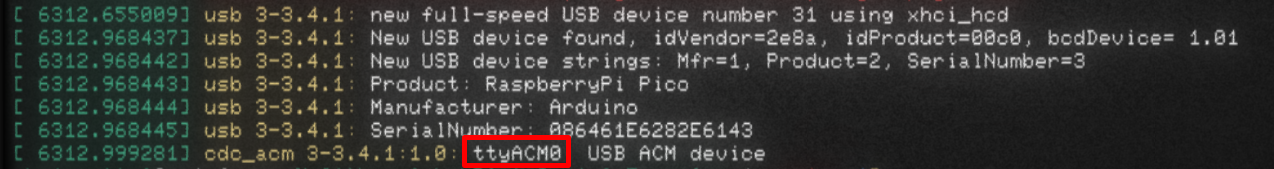
Output of sudo dmesg showing the Pico connecting as ttyACM0
Output of ls /dev/tty*:
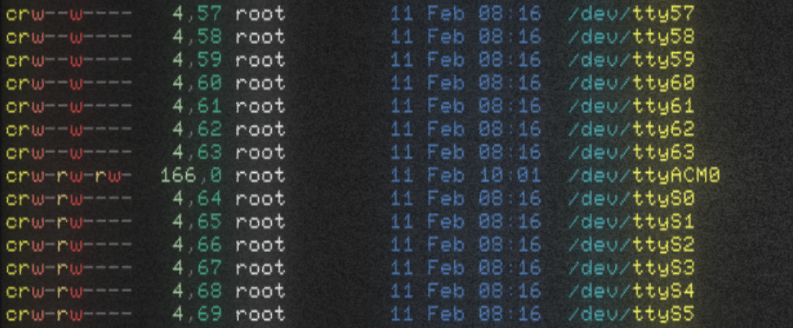
Available tty devices showing the connected Pico
Windows
On Windows, the device will appear as a COM port (e.g., COM3, COM4). Check Device Manager to identify the correct port.
macOS
Use the terminal to list available devices:
ls /dev/tty.*
Testing Serial Communication
Before setting up LabPlot, test the serial connection using a terminal emulator:
Linux Example
Using Picocom:
picocom -b 9600 /dev/ttyACM0
Windows Example
Use PuTTY with the following settings:
Connection type: Serial
Serial line: COM3 (or your identified port)
Speed: 9600
Example 1: Single Value ASCII
Configuration
Set the mode in your Pico code to:
const uint8_t mode = singleASCII;
This mode sends a single ASCII value every INTERVAL milliseconds, ending with \r\n.
Expected Output
When connected via terminal, you should see output like:
1.000000000
0.951056540
0.809017003
0.587785244
0.309017003
0.000000000
-0.309017003
-0.587785244
-0.809017003
-0.951056540
-1.000000000
This represents a sine wave with values calculated by the microcontroller.
Setting up LabPlot Live Data Source
Add Live Data Source: In LabPlot, go to the menu and add a new live data source
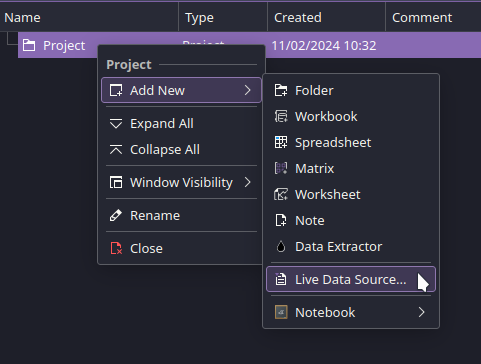
Adding a new Live Data Source in LabPlot
Configure Serial Settings:
Source Type: Select “Serial Port”
Serial Port: Choose your identified port (e.g.,
/dev/ttyACM0)Baudrate: Set to
9600(matching your code configuration)Update Interval: Set to match your
INTERVALsetting (1000 ms by default)
Data Format Settings:
Data Format: ASCII
Column Separator: Not applicable for single values
Create Timestamp: Enable if desired
Create Index: Enable if desired
Apply Custom Filter: Configure any necessary data filtering
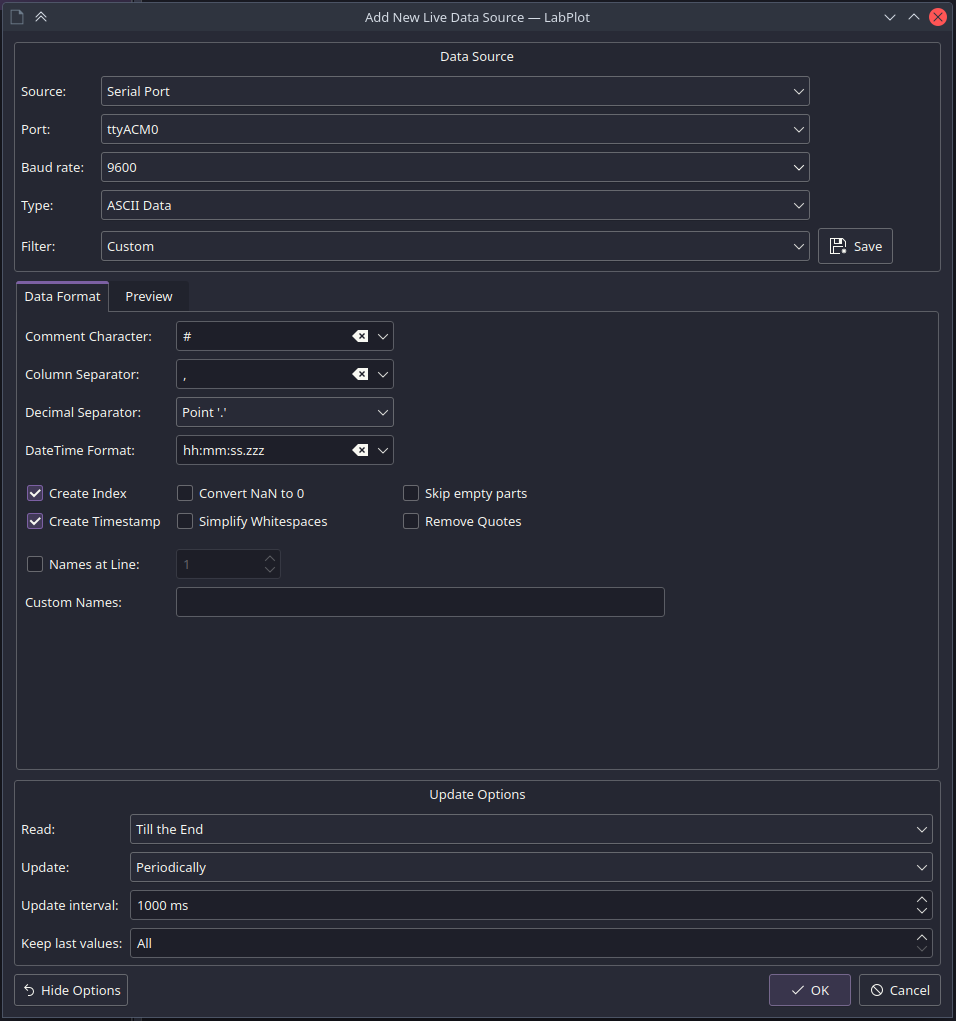
Live Data Source configuration settings for serial communication
Result
After accepting the settings, you should see your live data source updating every interval with new data. The spreadsheet will show:
The received sine wave values
Timestamps (if enabled)
Index numbers (if enabled)
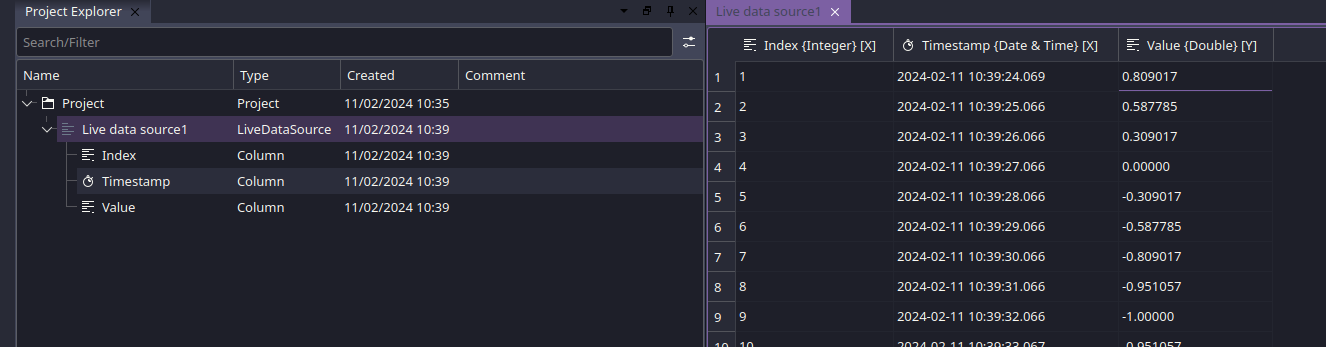
Live Data Source showing updating values with timestamps and index
Creating a Live Plot
Create a new worksheet and add an XY-curve
Set the data source to your live data source
Configure X-axis to use timestamps or index
Configure Y-axis to use your data values
The plot will show a live-updating sine wave
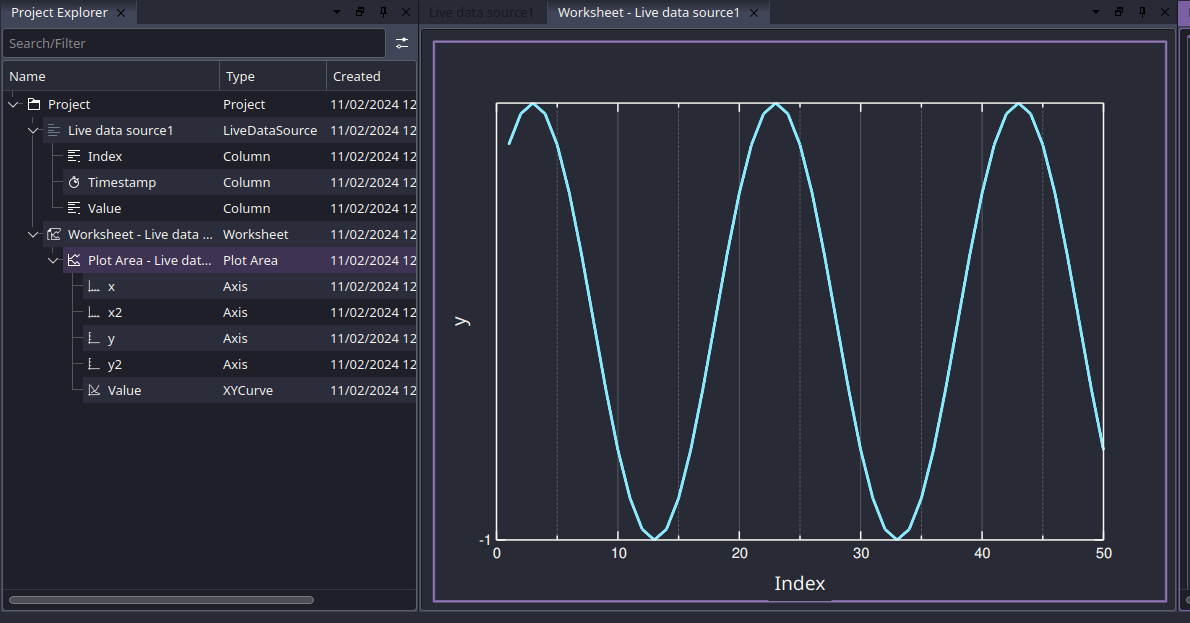
Live updating sine wave plot showing real-time data from the Pico
Example 2: Multi Value ASCII
Configuration
For sending multiple values simultaneously, set:
const uint8_t mode = multiASCII;
This mode sends multiple ASCII values separated by the defined SEPERATOR (comma by default).
Expected Output
The serial output will contain multiple comma-separated values per line:
1.000000000,0.500000000,0.250000000,0.125000000
0.951056540,0.475528270,0.237764135,0.118882068
0.809017003,0.404508502,0.202254251,0.101127125
Example of multi-value ASCII output showing multiple data streams
Setting up Multi-Value Live Data Source
The configuration is similar to single values, but with these differences:
Column Separator: Set to comma (
,) or your chosen separatorMultiple Columns: LabPlot will automatically create separate columns for each value
This allows you to plot multiple data streams simultaneously, each updating in real-time.
Troubleshooting
Common Issues
- Port Access Denied (Linux)
Install udev rules as mentioned in prerequisites, or run with sudo (not recommended for regular use).
- No Data Received
Verify baudrate matches between Pico code and LabPlot settings
Check that the correct serial port is selected
Ensure the Pico is running the correct firmware
- Irregular Updates
Match the update interval in LabPlot exactly to your Pico’s send interval
This requirement may change in future LabPlot versions
- Connection Lost
Check USB cable connection
Verify the Pico hasn’t reset or changed ports
Restart the live data source in LabPlot
Tips for Success
Test First: Always test serial communication with a terminal emulator before configuring LabPlot
Match Settings: Ensure baudrate and timing match between all components
Start Simple: Begin with single value ASCII mode before attempting multi-value streams
Monitor Resources: Live data can consume memory over time; consider data limits for long-running sessions
Advanced Applications
The serial communication examples can be extended for various real-world applications:
Sensor Monitoring: Stream data from temperature, humidity, or pressure sensors
Motor Control Feedback: Monitor speed, position, or current from motor controllers
Environmental Monitoring: Collect and visualize environmental data in real-time
Prototype Testing: Validate embedded system behavior during development
Further Resources
Contributing
If you have improvements or additional examples for serial communication with LabPlot, consider contributing to the original repository or sharing your experiences with the LabPlot community.
License
The original examples are licensed under GPLv3.
Acknowledgments
This tutorial is based on work by Chrismettal and was created in collaboration with the LabPlot development team.
If you enjoy this tutorial, consider supporting the original author
If you use LabPlot regularly, consider supporting LabPlot’s developers